Installation
This guide walks you through every step of installing ReturnShield AI on your Shopify store, from the initial app install through your first applied fix. Estimated time: 15 minutes for the install itself, plus up to 24 hours for the initial data analysis to complete.
Requirements
Before you begin, confirm your store meets these prerequisites:
- A Shopify store on any paid plan — Basic, Shopify, Advanced, or Plus
- Admin access to install apps from the Shopify App Store
- At least 30 orders with return data in your order history for meaningful AI analysis. Stores with fewer than 30 returns will install successfully but will see a "Not enough data" state on the dashboard until more history accumulates.
- Return processing enabled — ReturnShield reads completed (refunded and returned) orders, not just return requests. If your store does not process returns through Shopify's native return system, some analysis may be limited.
Step 1: Install from the Shopify App Store
- Visit the ReturnShield AI listing on the Shopify App Store.
- Click "Add app".
- You will be redirected to your Shopify admin to review the requested permissions. Read through them carefully — they are explained in detail below.
- Click "Install app" to confirm.
- ReturnShield AI appears in your Shopify admin under Apps.
What Permissions Are Requested and Why
Shopify shows a permission consent screen before installation. Here is exactly what each permission does and why ReturnShield needs it:
| Permission | Scope | Why it is needed | What it does NOT access |
|---|---|---|---|
| Read orders | read_orders | Reads order data, return notes, and refund records to build the return analysis dataset. Without this, no analysis is possible. | Payment gateway data, customer card numbers |
| Read customers | read_customers | Reads customer purchase history to calculate risk scores and assign segment tiers (Champions, Standard, At Risk, Serial Returners). | Passwords, payment methods, saved addresses not associated with orders |
| Read products | read_products | Reads product titles, descriptions, and variant data to generate word-level diffs in the Action Queue and power the sizing widget. | Draft products you haven't published |
| Write products | write_products | Required to apply Action Queue fixes directly to product listings. Without this, every fix requires manual copy-paste into the Shopify product editor. | Product pricing, inventory, collections |
| Write customer metafields | write_customers (metafields only) | Writes the returnshield.risk_tier metafield to customer records. Your email marketing tools (Klaviyo, Omnisend) read this field to trigger segment-based flows. | Customer account details, order history modification |
| Read analytics | read_analytics | Accesses order-level analytics for return rate benchmarking against category averages. | Revenue reports, marketing attribution data |
ReturnShield does not request payment information, checkout settings, theme access, or storefront rendering. All data is processed via the Shopify API and stored in ReturnShield's GDPR-compliant infrastructure (EU-West data residency).
What if you deny a permission? Denying write_products means you can see Action Queue suggestions but cannot apply them directly — you would need to copy the proposed changes manually. All other permissions are required for the core functionality.
Step 2: Initial Data Sync
After installation, ReturnShield AI immediately begins importing your historical data. No action is required — the sync starts automatically.
The initial sync process performs these steps in sequence:
- Imports 90 days of order and return data from your store via the Shopify Orders API
- Processes return notes using NLP to extract complaint patterns such as "runs small", "color not as shown", or "material feels cheap" — this step can take up to 24 hours for large stores
- Scores every product on a 0–100 risk scale based on return rate, return note patterns, and variance from category benchmarks
- Segments every customer into one of four risk tiers (Champions, Standard, At Risk, Serial Returners) based on their return history
- Generates the initial Action Queue — a prioritized list of product description fixes ranked by expected monthly savings
You do not need to wait for the sync to complete before exploring the interface. The dashboard shows a live sync progress indicator and populates data incrementally as analysis completes.
Monitoring Sync Progress
- Go to Apps → ReturnShield AI
- Navigate to Settings → Data Sync
- The progress bar shows the percentage of orders processed and estimated completion time
If the sync progress has not advanced for more than 4 hours, click "Restart sync". For large stores with 50,000 or more orders, an occasional manual restart during the initial import is normal.
What Populates and When
The dashboard does not go from empty to complete all at once. Data appears incrementally:
| What appears | When it appears | |---|---| | Return rate trend chart | After the first batch of orders is processed (typically within 30 minutes) | | Industry benchmark comparison | After your product categories are identified (1–2 hours) | | True cost calculator | After return rate metrics are available | | Product risk scores | After all return notes are analyzed (2–24 hours depending on volume) | | Customer segments | After customer order histories are fully processed | | Action Queue (first items) | After at least 5 products have 5+ returns with pattern matches | | Action Queue (complete) | After full NLP analysis completes |
If your store has fewer than 30 completed returns, the product risk scores and Action Queue will show a "Not enough data" state even after the sync completes. This is by design — the AI needs a statistically meaningful sample.
Step 3: Dashboard Walkthrough
Once the initial sync completes — or partially completes — your dashboard provides an overview of your return health.
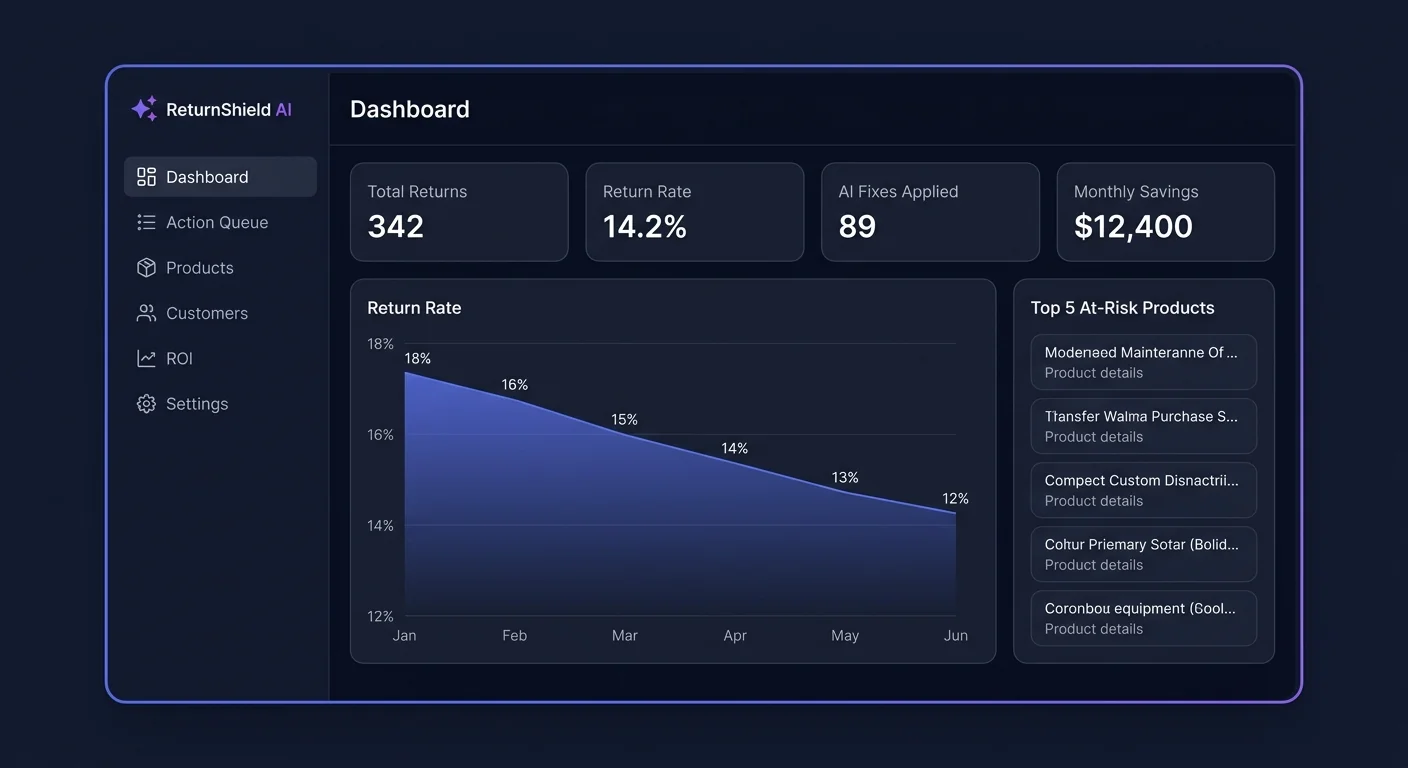
The dashboard is organized into five sections:
Return Rate Overview (top row)
Three metrics shown side by side:
- Your current return rate — returns as a percentage of orders, calculated over the selected date range
- Industry benchmark — the average return rate for stores in your product category
- Your 12-month baseline — your own historical average to contextualize seasonal fluctuations
A green dot means you are performing better than industry average. Amber means within 1.5x the benchmark. Red means you have exceeded 1.5x the benchmark — ReturnShield will have generated Action Queue items targeting the specific products driving this elevated rate.
Return Rate Trend Chart
The 90-day line chart shows your return rate over time. Spikes often correspond to specific events — a product launch with inaccurate photos, a seasonal promotion driving impulse purchases with high regret, or a batch of goods with sizing inconsistency from a specific supplier run.
Click any spike on the chart to filter the product risk table below to products with elevated return rates during that period. This is one of the fastest ways to connect a spike to a root cause.
True Cost Calculator (right column)
Shows the actual cost of returns beyond refund amounts — including outbound shipping, return shipping, processing time, and restocking losses. This figure is typically 2–3x the refund value alone. See Cost Assumptions to enter your actual warehouse cost data.
Product Risk Scores (center table)
Every product in your catalog ranked by return risk score. High-risk products (score 70+) have pending Action Queue fixes ready for review.
AI Action Queue (bottom right)
A preview of the top pending fixes sorted by expected monthly savings. Click any item to open the full Action Queue for review and application.
Step 4: Apply Your First Fix
The fastest way to see ReturnShield's value is to apply one fix from the Action Queue:
- Go to the Action Queue tab (or click "View all" from the dashboard preview)
- The first item in the queue has the highest expected monthly savings — open it
- Read the evidence summary (e.g., "11 of 18 returns in the last 90 days mention 'tight shoulders'")
- Review the word-level diff — red text will be removed, green text will be added
- Verify the proposed change makes sense in the context of the evidence
- Click "Apply" to update the product description in Shopify immediately
After applying, ReturnShield tracks the product's return rate over the next 60 days and compares it to the pre-fix baseline. You can monitor the outcome in the Applied tab of the Action Queue.
Plan Comparison
Choose the plan that fits your current order volume and the depth of automation you need.
| Feature | Free | Starter ($29/mo) | Growth ($79/mo) | Scale ($199/mo) | |---|---|---|---|---| | Monthly order cap | 50 | Unlimited | Unlimited | Unlimited | | Return Intelligence Dashboard | Yes | Yes | Yes | Yes | | Industry benchmarks | Yes | Yes | Yes | Yes | | True cost calculator | Yes | Yes | Yes | Yes | | Product risk scores | Yes | Yes | Yes | Yes | | AI Action Queue | — | Yes | Yes | Yes | | Apply fixes directly to Shopify | — | Yes | Yes | Yes | | Customer risk scoring (0–100) | — | Yes | Yes | Yes | | Customer segments (4 tiers) | — | Yes | Yes | Yes | | Shopify metafield sync | — | Yes | Yes | Yes | | Bracketing detection | — | Yes | Yes | Yes | | Sizing social proof widget | — | Yes | Yes | Yes | | Shopify Flow triggers + actions | — | — | Yes | Yes | | Post-purchase "How's it Fit?" email | — | — | Yes | Yes | | Post-return survey | — | — | Yes | Yes | | Return spike alerts | — | Yes | Yes | Yes | | Data retention | 90 days | 12 months | 12 months | Unlimited | | Support | Community | Email (2 BD) | Email (1 BD) | Priority (same day) | | Dedicated customer success | — | — | — | Yes |
BD = business days.
Free Plan
Best for: New stores exploring whether returns are a significant cost driver. Most stores upgrade to Starter once they see the true cost calculation and realize the ROI available from fixing product descriptions. The Free plan's 50-order cap means it will not suit any established store — it is a trial experience.
Starter ($29/mo)
Unlocks the AI Action Queue, customer risk scoring, all four customer segments, and unlimited orders. This is the most common plan for stores at 50–500 orders per month.
Best for: Stores where the top return issue is product description accuracy — the most common driver of fixable returns. The ROI calculation is straightforward: if the Action Queue identifies $500/month in preventable returns, Starter pays for itself in the first applied fix.
Growth ($79/mo)
Adds Shopify Flow triggers and actions, post-purchase emails ("How's it Fit?"), and post-return surveys. The survey responses feed directly back into the AI analysis with 2x weighting — meaning Growth plan stores accumulate better training data over time and generate higher-confidence Action Queue items.
Best for: Stores with established return patterns where automation and follow-up communications will compound the improvement from description fixes. The Shopify Flow integration enables automatic order tagging and fulfillment holds for high-risk customers without any manual review.
Scale ($199/mo)
Adds unlimited data retention (Free and lower plans cap at 90 days or 12 months), priority support with same-day response, and dedicated customer success with quarterly business reviews.
Best for: High-volume stores processing 500+ returns per month where year-over-year trend analysis, seasonal comparison, and long-tail product history are needed. Scale also makes sense for stores with complex SKU structures where the AI needs more historical data per product to generate reliable confidence scores.
First 24 Hours: What to Configure and Check
Complete this checklist in the first 24 hours after installation to establish a solid baseline:
Immediately after install (first 30 minutes)
- Verify sync is running — Go to Settings → Data Sync and confirm the progress bar is moving. Note the estimated completion time.
- Enter your cost assumptions — Go to Settings → Cost Assumptions and enter your actual warehouse processing cost per return (typically $5–$20) and your return shipping cost. The default estimates are conservative — your real numbers will show a larger true cost figure.
- Review your plan — If you have more than 50 orders per month (which most established stores do), you are already beyond the Free plan's cap. Consider upgrading to Starter before the sync completes so the full feature set is available when data populates.
After sync completes (first 24 hours)
- Review the Action Queue — Open the Action Queue and read the top 5 items. For each one with 10+ data points and a high confidence score (80+), consider applying it. The evidence summary tells you exactly which return notes are driving the suggestion — verify the complaint matches what you see in your own Shopify return notes.
- Check customer segments — Go to Customers → Segments and note how many customers are in the At Risk and Serial Returners tiers. If Serial Returners are a meaningful percentage (more than 2%), the bracketing detection and Shopify Flow integration on Growth plan will pay off quickly.
- Set up return spike alerts — Go to Settings → Alerts and enable return spike notifications. Set the threshold to "25% above your 30-day average" as a starting point. You can tighten this later as you build intuition for your store's normal variation.
First week
- Connect Klaviyo or Omnisend (Growth plan) — Customer segment data writes to the
returnshield.risk_tierShopify metafield automatically. Create a Klaviyo segment or Omnisend audience based on this metafield. Use it to suppress Serial Returners from promotional emails that encourage low-intent purchases. - Monitor your first applied fix — Check the Applied tab weekly. After 30 days you will have preliminary outcome data. After 60 days ReturnShield reports the full pre/post comparison.
Data Sync Cadence After Initial Import
After the initial 90-day sync, ReturnShield updates data on a rolling basis:
| Data type | Update frequency | |---|---| | Return rate metrics | Daily (overnight) | | Product risk scores | Daily (overnight) | | Customer segments | On each new return processed | | Action Queue items | Nightly — new items added as patterns emerge | | Fix outcomes (Applied tab) | Weekly — compares pre/post return rates for applied fixes |
Next Steps
- Configuration Guide — every setting explained with recommended values for different store sizes
- Dashboard Walkthrough — detailed explanation of each metric and how to interpret the trend chart
- AI Action Queue — how the AI analyzes return notes and what the evidence summaries tell you
- Shopify Flow Integration — automate order tagging and fulfillment holds based on customer risk data